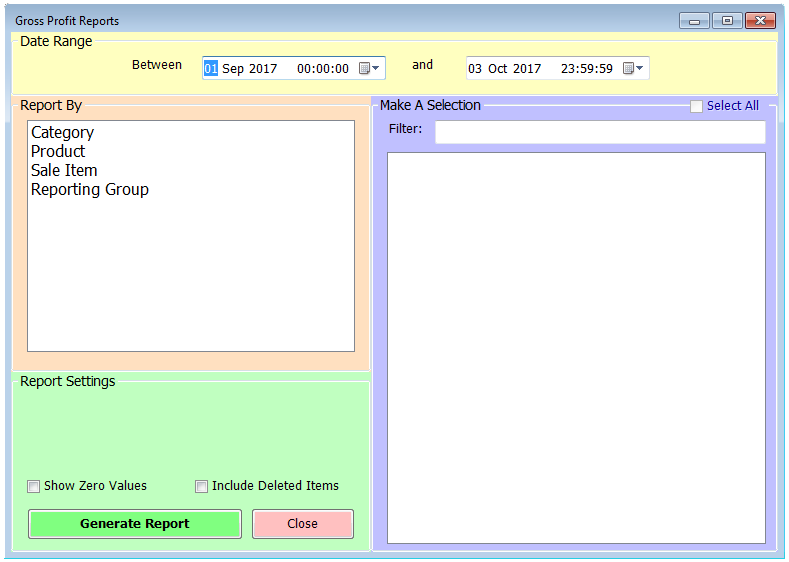
GP Reports are similar in configuration and setup to the Total Sales Report, but as well as revenue they report on cost and so Gross Profit. The primary screen is shown below.

The date range you wish to use for the report is set using the start and end date selectors at the top of the screen. Because the length of the report is unaffected by the size of the date range you can safely select as broad or as narrow a range as you wish. Naturally, the larger the date range the longer the report will take to build but even periods of over a year should only take a few seconds.
Next you will need to select the type of report from the list on the left – Category, Product, Sale Item or Reporting Group. Doing so will generate a list of the corresponding entries on the right hand side. You can then select the items that you want to report on either by clicking them individually, searching for them using the filter box at the top to type the first few letters or select all relevant options by clicking the Select All option at the top right.
There are additional options available for all report types, to show any zero value lines and to include deleted items. Once you’ve made your selections just click ‘Generate Report’.
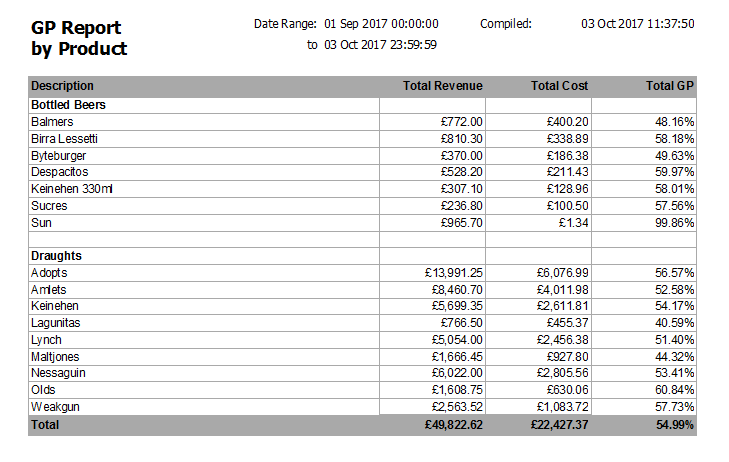
The reports for Category, Product, Sale Item and Reporting Group all generate similar headings with the name of the relevant item, the total revenue in the period, the total cost and the total GP percentage. The Sale Item and Product options have sub-headings by category.
Please note that the revenue figures shown include VAT but the cost figures do not.

