The top sellers report form provides a number of options for you to build different reports all based around which items have sold best or which clerks have sold most.
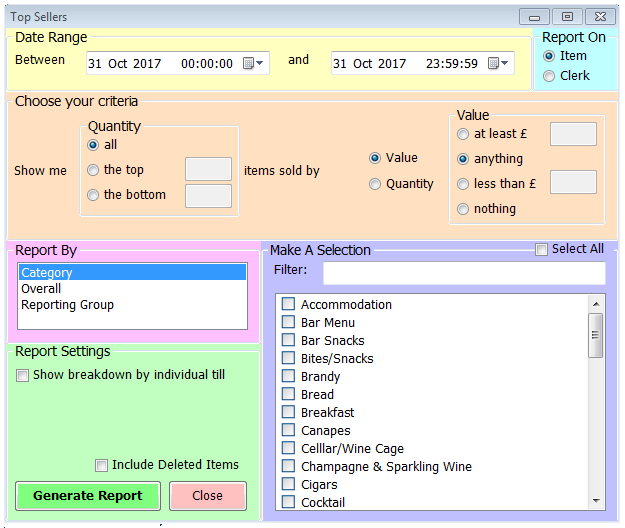
As with most reports you start by setting a date range. Next, there’s a choice between reporting on Items or Clerks. This then sets the remaining options accordingly. Item reports will always return a line for each sale item that meets your criteria. Clerk reports return a line per employee.
You can choose how many results to return – the default is to return all matching results but you can select instead to view just the top or bottom n results, where n is the number you enter in the relevant box.
Your next selection is whether to base the results on the value of sales or the quantity. Having made this choice you then have a further selection to set a minimum or maximum value, or indeed to return results where either any or none have been sold.
Your report will be based on the type of item you choose next – Category, Overall or Reporting group. If you select Category, you’ll see a list of categories which you can select from. Each category you tick will appear in the report with a line for each item that qualifies under its heading. If you select Overall, then the category selection box will also provide the option of expanding to show the sale items within each category. If necessary you can select only certain items though as the name suggests this Overall selection should show you the best selling items overall. The third and final option is by Reporting Group, and as with the category selection you’ll see each Reporting Group heading followed by the relevant number of items within that group. Each selection you make in this list will generate the number of results you’ve chosen; in other words if you select the top 5 records and then choose the category breakdown, your results will include the top 5 items from each category selected.
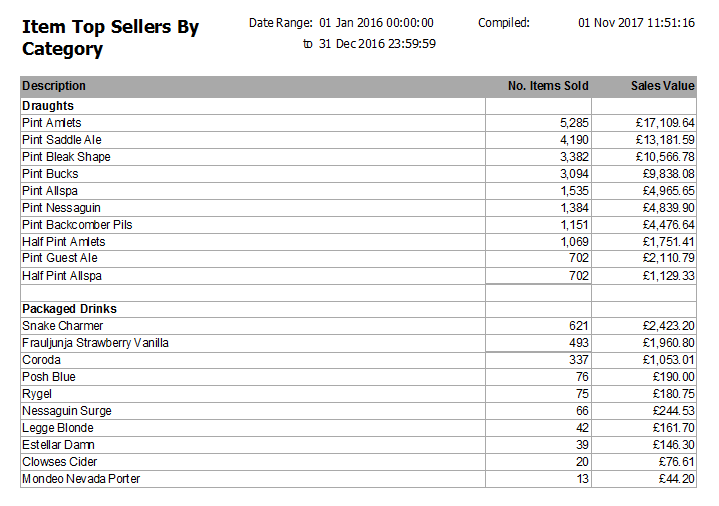
As with many other reports you can choose to view these item results broken down by individual till, and you can select to include deleted items if you’re reviewing historic periods or have recently deleted items. The example below shows the top 10 items from the Draught and Packaged Drink categories with sales of more than 12 items in 2016.
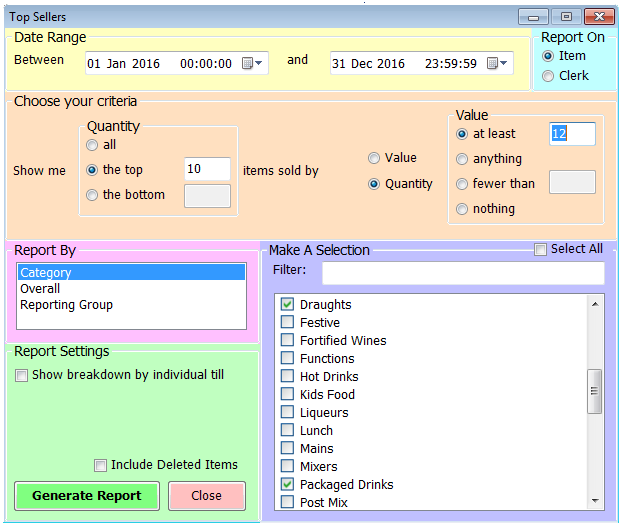
This generates the report below. You can see that under the Description column there’s the name of each selected category, followed by the results from within that category. Each item name is shown together with the number of items sold in the period and the sales value.
If you choose the Clerk option in the top right hand corner you’ll be presented with some different choices. As mentioned above, the Clerk reports return a line for each staff member who meets the criteria selected, so this will usually be a shorter report. This type of report is most often used to inform incentive schemes – these might be as broad as who takes the most money overall in a month or as narrow as who’s sold the most of a particular item on a promotional night.
As with the item reports you can select the number of results and base those on value or quantity of sales. You can also set minimum and maximum values as with the items report, choose to include deleted items and request a breakdown by till.
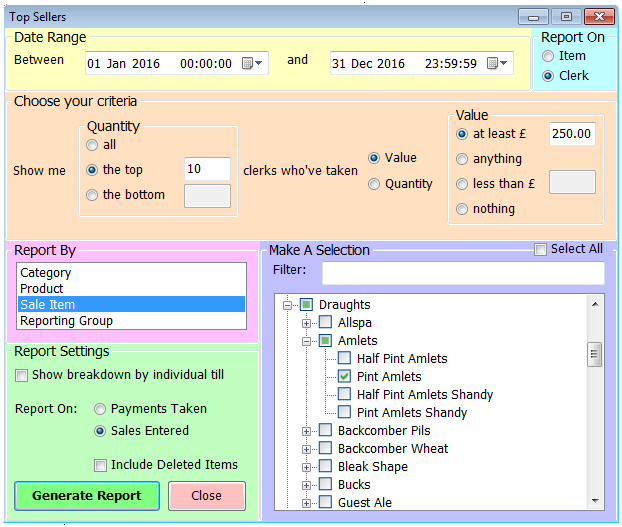
Instead of an overall option, alongside the Category and Reporting Group options you have the choice of looking at sales at a Product or Sale Item level. The Category and Reporting Group options provide a simple filter. The Product option allows you to expand each category to select individual products while the Sale Item option further allows those products to be expanded to select particular sale items. As such, if you want to know who’s sold the most of a particular lager, choose the Product report, but if you want to know who sells more Pints but not Half Pints, go for the Sale Item option. All options, regardless of the number of selections, merge sales to provide a single line per clerk.
Another additional option with the Clerk reports is to base the results on the Sales Entered rather than Payments Taken. This will be of use in environments where table service is used and so multiple members of staff are able to add to a table’s bill but only one person can be recorded as taking the payment.
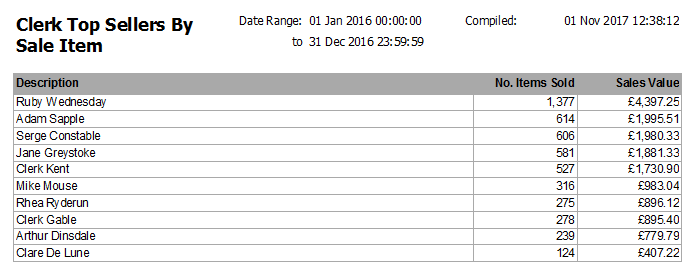
The criteria set below are to display the top 10 clerks who rang in at least £250 worth of pints of Amlets in 2016. The resulting report follows, showing the names of the staff who meet the criteria in descending order of sales value, along with the number of items sold. Note that had the report been by quantity rather than value, positions seven and eight would have been reversed.